Equity Indicators Dashboard
Mission
Equity Indicators are one tool local governments can use to measure and track the experiences and disparities among community members and racial groups to proactively address systems that perpetuate racism and/or oppression.
Los indicadores de equidad son una herramienta que los gobiernos locales pueden usar para medir y rastrear las experiencias de igualdad entre los miembros de la comunidad para abordar de manera más proactiva los sistemas que perpetúan el racismo y / o la opresión.
The Equity Indicators Dashboard is a work in progress.
More measures, explanations, and easy-to-understand graphics will be added, and the dashboard will continue to grow over time.
El dashboard (o tablero de datos) del Proyecto de Indicadores de Equidad: la primera versión del dashboard está activa. El dashboard de Indicadores de Equidad es un trabajo en progreso. Durante los próximos meses se agregarán más medidas, explicaciones y gráficos fáciles de comprender.
Click a Domain below to explore Indicators.
More Domains, including Civic Engagement, Public Health, Environmental Justice, and Transportation will be added over time.

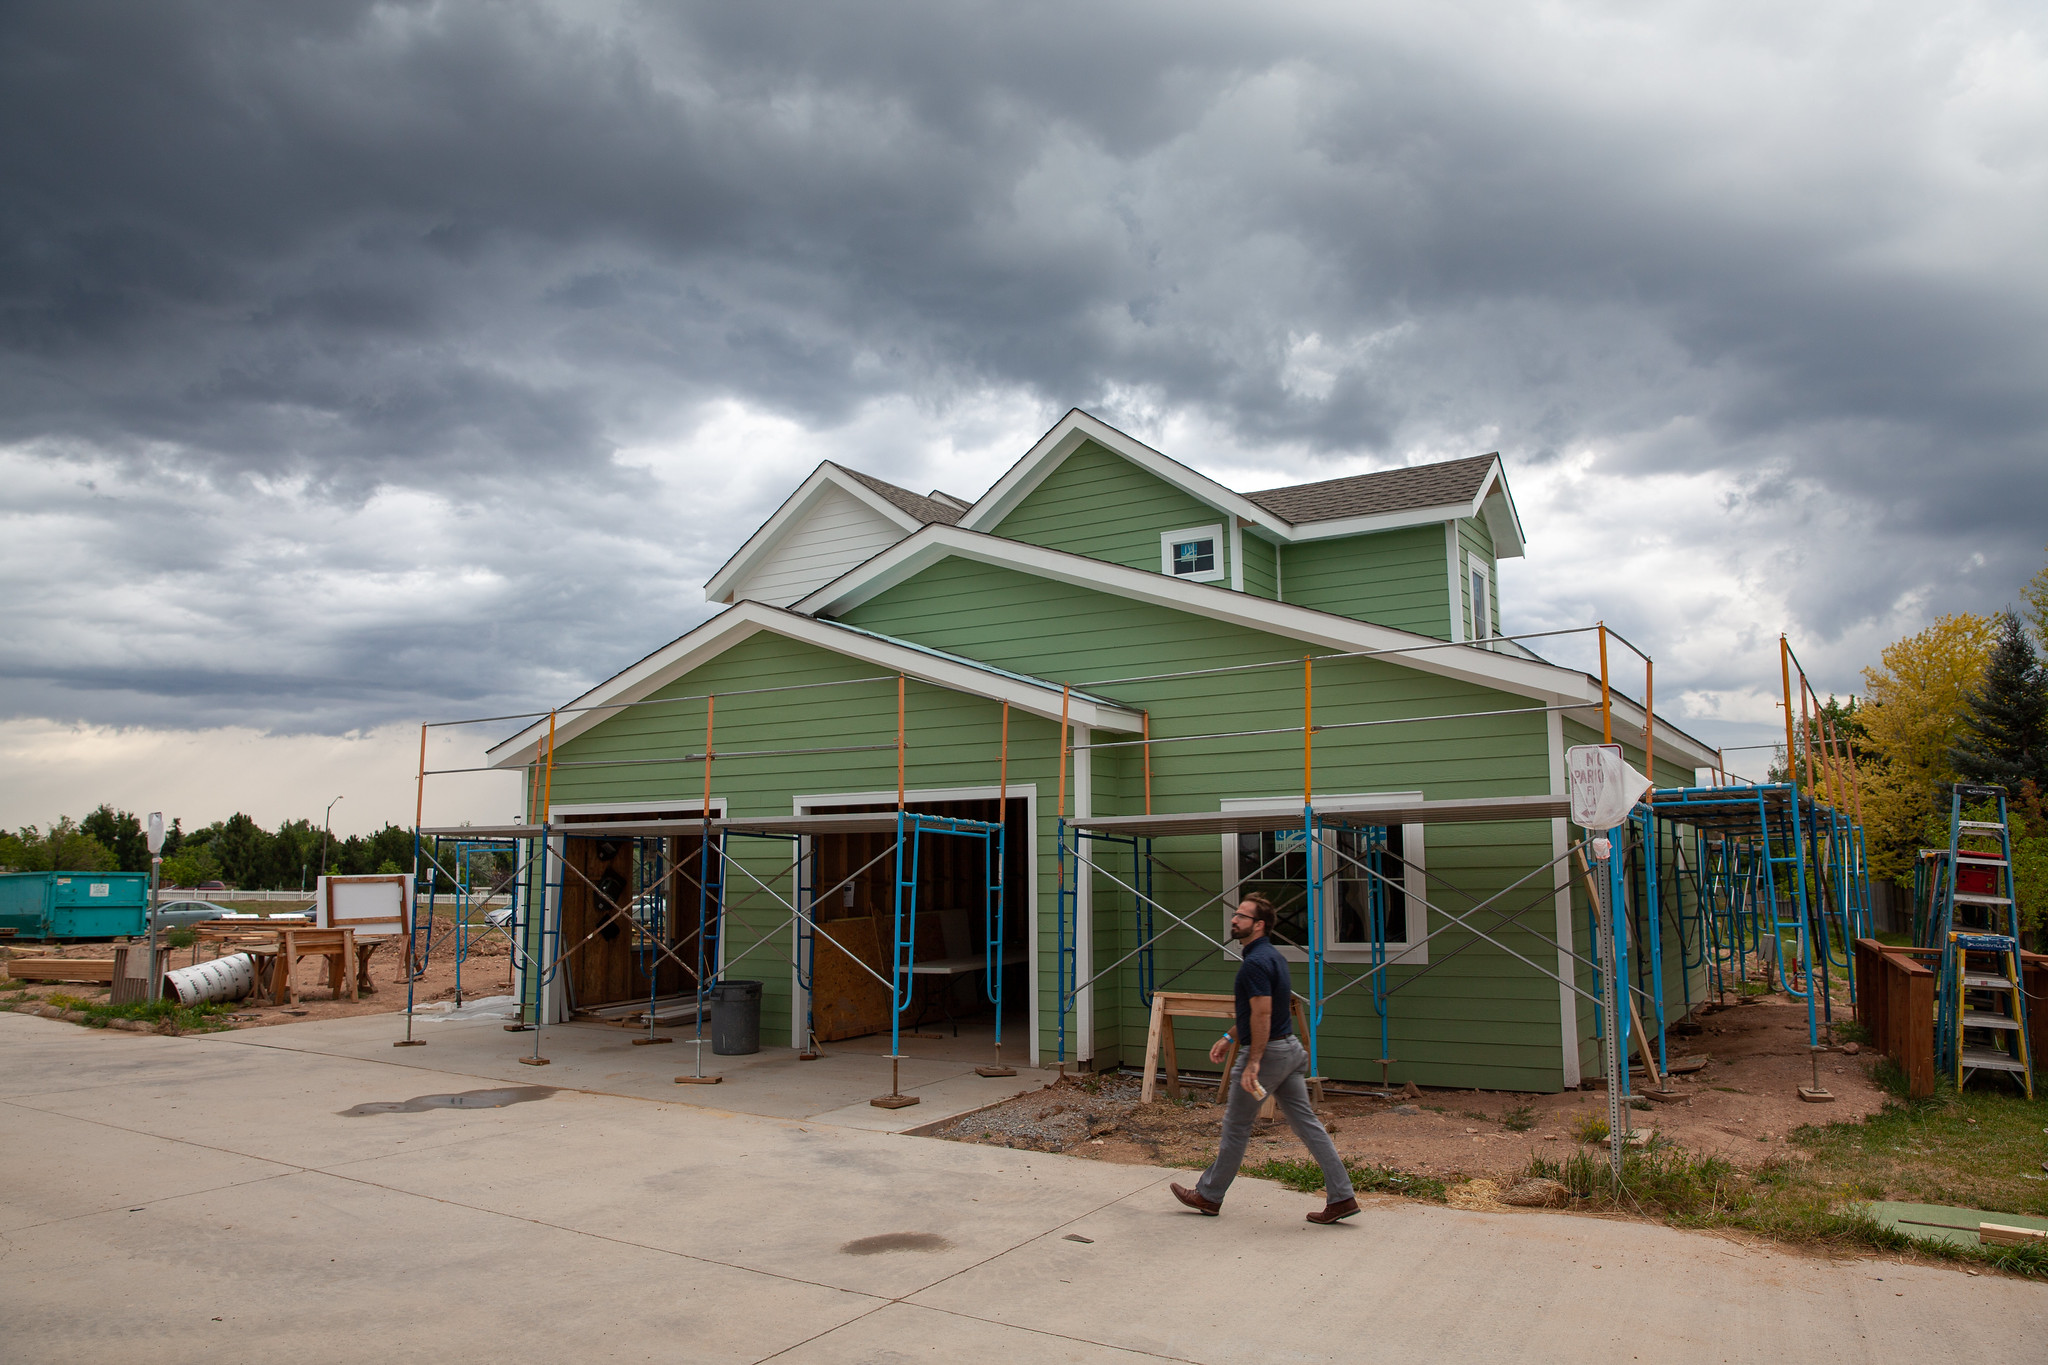
Criminal Justice & Public Safety
Explore Indicators related to policing and community safety.

Definitions and Resources
What is Equity?
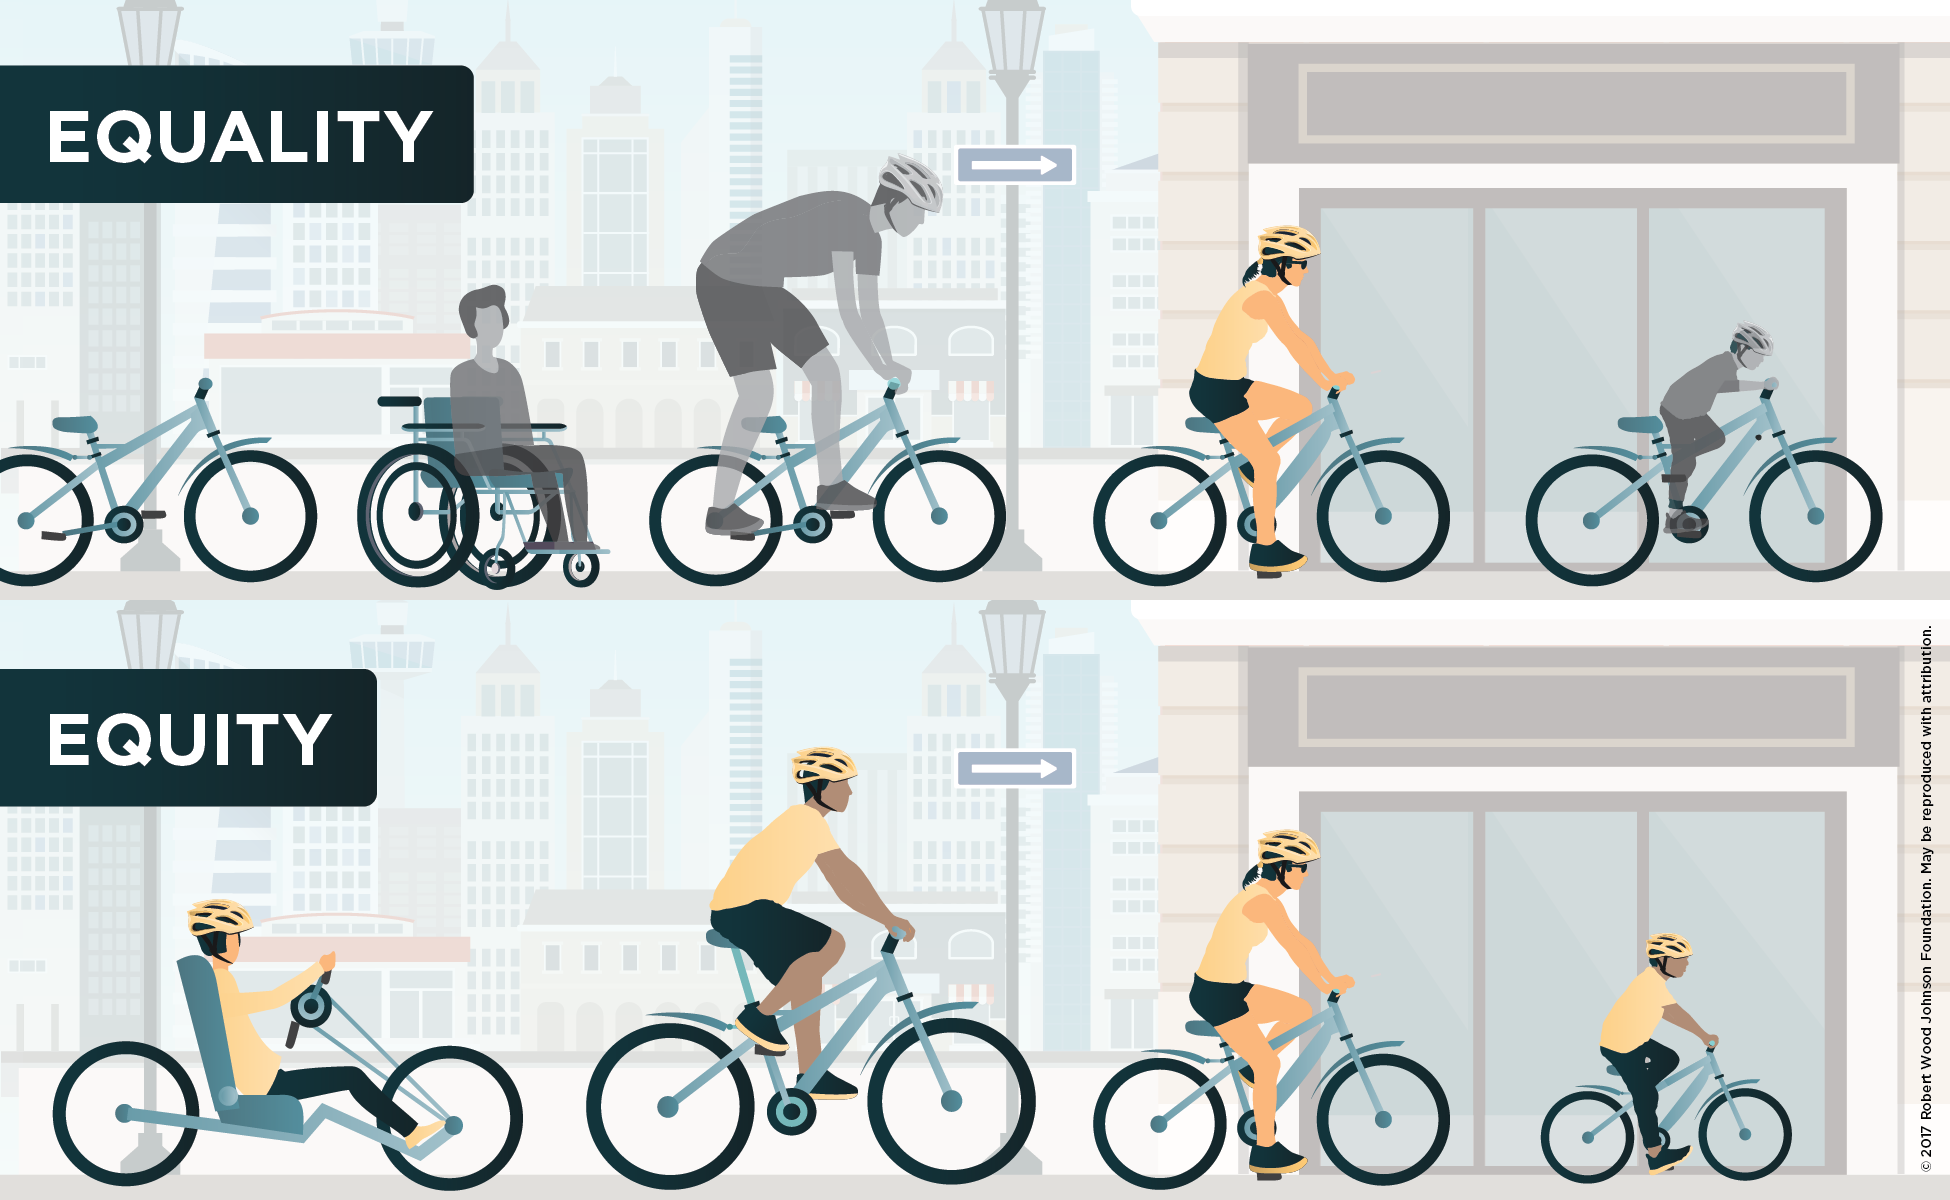
Equality is about treating everyone the same, while Equity means treating individuals and communities with consideration for their specific experiences, history, lived experiences, and needs in order to achieve equal outcomes. Equity is about understanding that not everyone has the same level of access to services and programs.

The graphic above illustrates the difference between “equity” and “equality”. Using an equality approach, everyone gets the same bicycle, regardless of their size, ability, or other needs. Using an equity approach, each person gets a bicycle custom to the their unique situation.
What is the Equity Indicators Dashboard?
The Equity Indicators Dashboard is a way to visually present the information included in the City of Fort Collins Equity Indicators Report. The Dashboard will continue to grow as Project Staff add more information and write the narrative of how the City of Fort Collins is working to reduce disparities and advance equity of all. The Dashboard aims to provide a simple summary and graphs of each Indicator in a Domain.
What is a Domain?
For the Equity Indicators project, similar Indicators are grouped into a common Domain. Domains include Indicators that are often measured and managed by through interdepartmental collaboration and shared measurement tools. For example, we currently include the Domains of: Criminal Justice and Public Safety, Economic Health and Opportunity, and Housing. Within each Domain are specific Indicators that explain the various elements of a Domain.
What is an Indicator?
The Equity Indicators are a set of measurements that describe how community member experience life and access services in Fort Collins. Each Indicator tells a piece of the story. Together, they help give a fuller picture of these experiences based on race, ethnicity, gender, age, sexual identity, class, and ability. You can think of an Indicator like a puzzle piece.
Each Indicator is accompanied by a graph that shows different groups’ experiences compared to the overall experience. In each graph, the red bars indicate that that group is experiencing inequity, usually showing that that group experiences the situation at a higher rate than average. The average or overall rate is shown as a black line across the graph. There is also a link to a PDF for each Indicator, sharing the summarized dataset.
Media
View media related to the City of Fort Collins Equity Indicators Report and Dashboard.
March 25, 2022: A Fort Collins report ‘pulled the veil back’ on inequities. Now what? Fort Collins Coloradoan.
April 28, 2022: Police Services responses to Equity Indicators Forum.
April 28, 2022: Social Sustainability responses on Housing to Equity Indicators Forum.
Definitions and Resources
What is Equity?
Equality is about treating everyone the same, while Equity means treating individuals and communities with consideration for their specific experiences, history, and needs in order to achieve equal outcomes. Equity is about understanding the not everyone has the same level of access to services and programs.
The graphic above illustrates the difference between “equity” and “equality”. Using an equality approach, everyone gets the same bicycle, regardless of their size, ability, or other needs. Using an equity approach, each person gets a bicycle custom to the their unique situation.
What is the Equity Indicators Dashboard?
The Equity Indicators Dashboard is a way to visually present the information included in the City of Fort Collins Equity Indicators Report. The Dashboard will continue to grow as Project Staff add more information and write the narrative of how the City of Fort Collins is working to reduce disparities and advance equity of all. The Dashboard aims to provide a simple summary and graphs of each Indicator in a Domain.
What is a Domain?
For the Equity Indicators project, similar Indicators are grouped into a common Domain. Domains include Indicators that are often measured and managed by through interdepartmental collaboration and shared measurement tools. For example, we currently include the Domains of: Criminal Justice and Public Safety, Economic Health and Opportunity, and Housing. Within each Domain are specific Indicators that explain the various elements of a Domain.
What is an Indicator?
The Equity Indicators are a set of measurements that describe how community member experience life and access services in Fort Collins. Each Indicator tells a piece of the story. Together, they help give a fuller picture of these experiences based on race, ethnicity, gender, age, sexual identity, class, and ability. You can think of an Indicator like a puzzle piece.
Each Indicator is accompanied by a graph that shows different groups’ experiences compared to the overall experience. In each graph, the red bars indicate that that group is experiencing inequity, usually showing that that group experiences the situation at a higher rate than average. The average or overall rate is shown as a black line across the graph. There is also a link to a PDF for each Indicator, sharing the summarized dataset.
Media
View media related to the City of Fort Collins Equity Indicators Report and Dashboard.
March 25, 2022: A Fort Collins report ‘pulled the veil back’ on inequities. Now what? Fort Collins Coloradoan.
April 28, 2022: Police Services responses to Equity Indicators Forum.
April 28, 2022: Social Sustainability responses on Housing to Equity Indicators Forum.

Equity Indicators Project Staff Team
Claudia Menendez, Equity & Inclusion Officer
Nick Heimann, Cultural Services
Leo Escalante, Neighborhood Services
Javier Echeverria-Diaz, Sustainability Services
Adelle McDaniel, Environmental Services
Jill Marx, Communications and Public Involvement
Rachael Johnson, Equity Office
With questions and comments, please contact Claudia at [email protected] or 970-232-0512. We welcome your feedback, suggestions, and comments.
The Equity Indicators Project is funded in part by the generosity of community donors.